This project showcases my abilities to calculate optimized routes of transportation. More specifically, this demonstrates our capacity to maximize profit along a transportation route, whilst minimizing the cost of travel.
Our project was heavily influenced by the Traveling Salesman problem. Inspired by the recent U.S. tour done by Twenty-One Pilots, we aimed to build an optimization model that creates the best possible tour route to earn profit and visit as many Twenty-One Pilots fans as possible, all while minimizing travel cost. We chose to construct our model using CPLEX programming.
It is important to note that while this project focuses on only 20 U.S. cities and one specific band, the skills and techniques used are transferable to any task that requires route optimization.
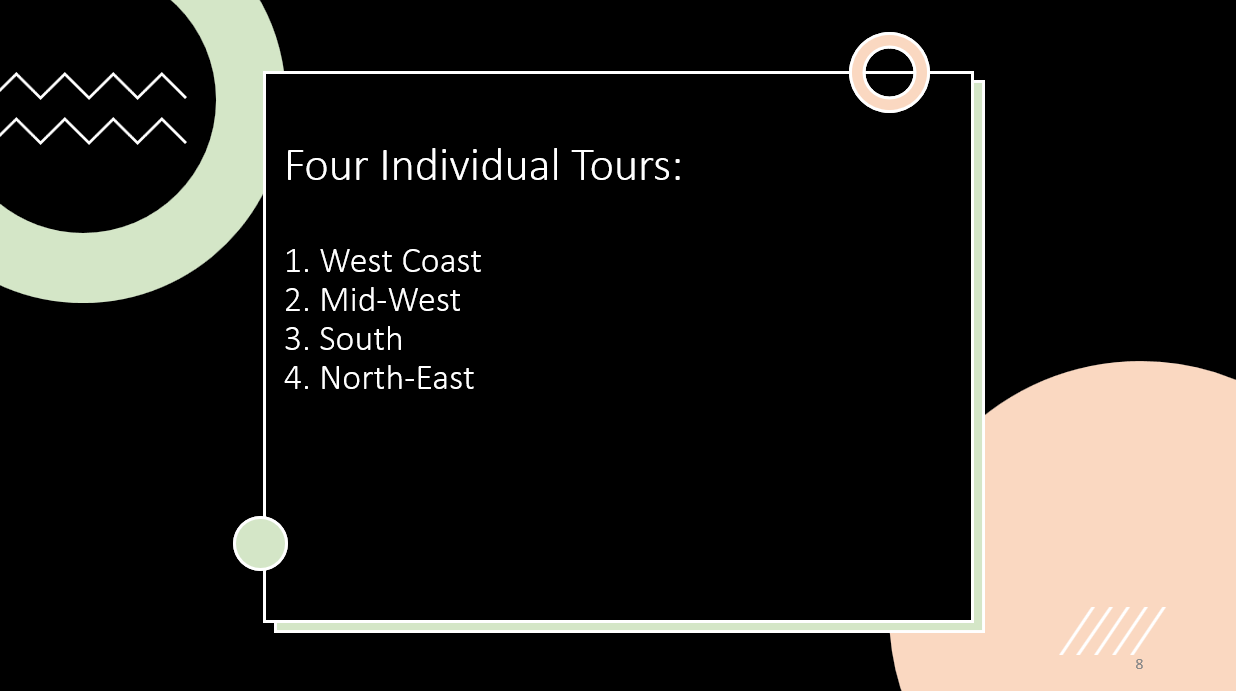
Nathan and myself were inspired to do this project for a multitude of of reasons.We wanted a fun and creative way of demonstrating our skills with route optimization, we accomplished this by creating two different versions of this model. Method one involves breaking up the tour into regions of the U.S. (West-Coast, Mid-West, South, and North-East), then connecting the end points manually. The second method is a heuristic type approach that includes all the cities and builds the entire tour at once. The reason we chose Twenty-One Pilots as our band to focus on was we knew they were big enough to have quality data available we could use.
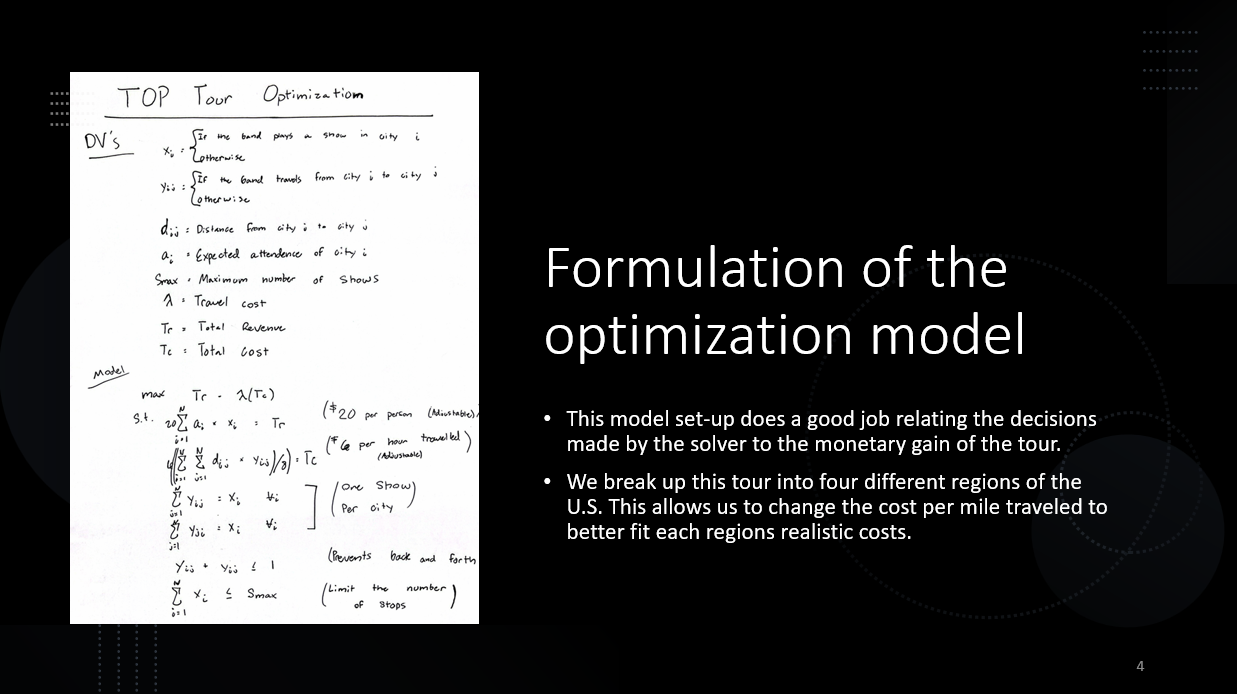
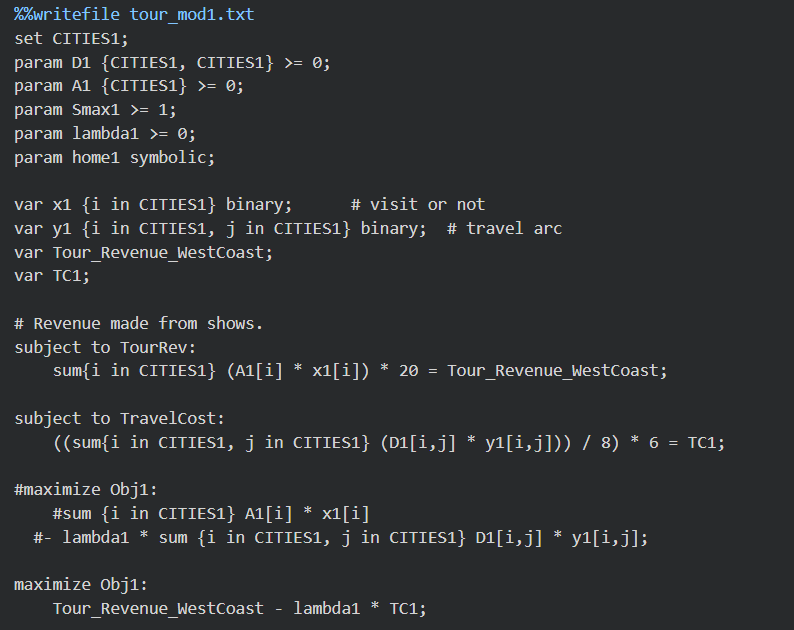
The formulation of our model is relatively straight forward. Two Binary decision variables are needed, detailing whether or not we visit a certain city, and whether or not we travel directly from one city to the next. We then have a selection of parameters that are responsible for deciding aspects of the tour such as: How many total cities will the band visit? How much do we wish to prioritize fan attendance versus distance traveled? What is the expected attendance at each venue?
Next up, we define our objective function. For this tour, our goal was to maximize total profit and minimize the total cost along the way. Total revenue was calculated by multiplying the expected attendance of each visited venue by a ticket price set by us that is adjustable. Our Total cost was a culmination of gas prices across the U.S. as well as the cost of living in each region. The beauty of breaking up our model into U.S. regions was it allowed us to change the cost travelling depending on the region of the county the band is in.
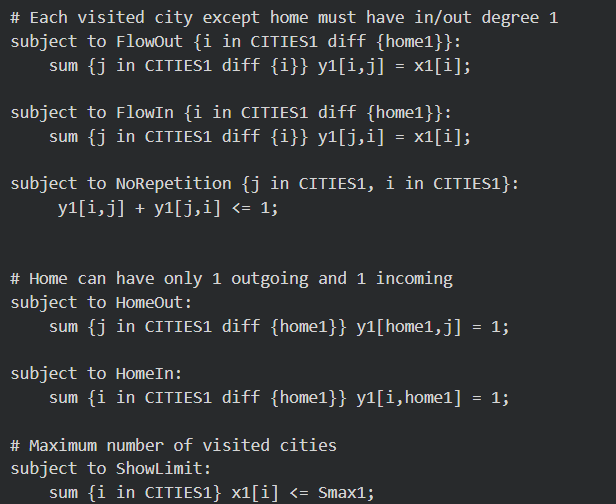
Lastly it was time to build the constraints for our model. We have roughly 5 constraints total. Two of which we’ve already discussed for the total revenue and total cost. The other three are constraints that limit the number of stops along the tour, ensure that the band only performs one show per city, and makes sure that the route does not bounce back and forth between two cities over and over again.
As previously mentioned, we expected quality data to be accessible with selecting Twenty-One Pilots as our band. Our research led us to a map developed by the New York Times that depicts the popularity of the band in different areas of the U.S. in detail.

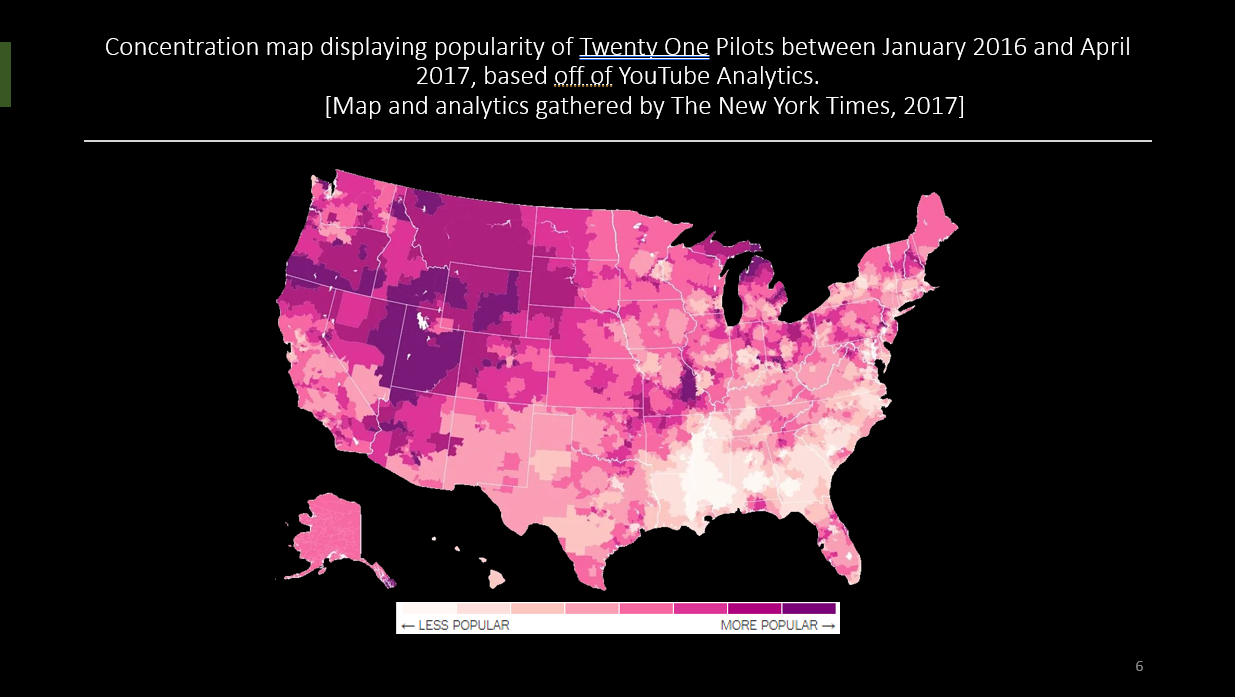
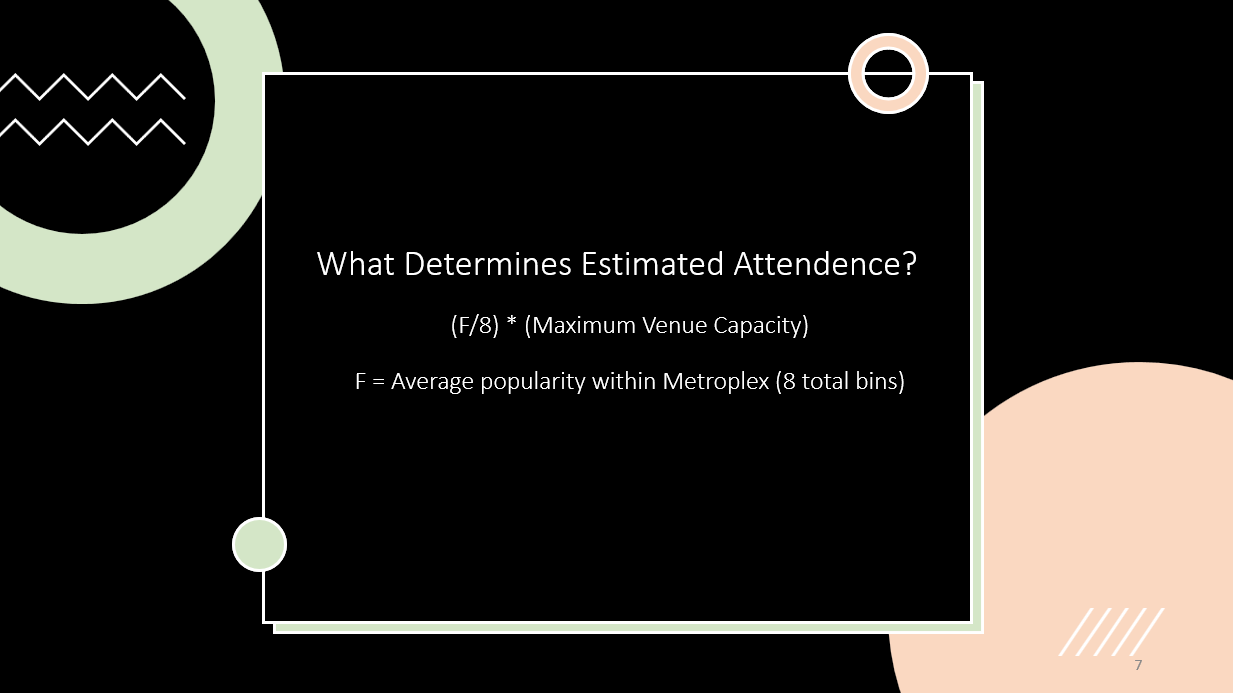
We relied heavily on this map when determining the expected attendance of each venue in each city. As you can see, the map is highlighted on a scale of 0 - 8, 0 being the lowest fan popularity and 8 being the highest. Using this 8 degree scale, as well as venue size, and city population, we wear able to calculate a relatively accurate attendance estimation for each city.
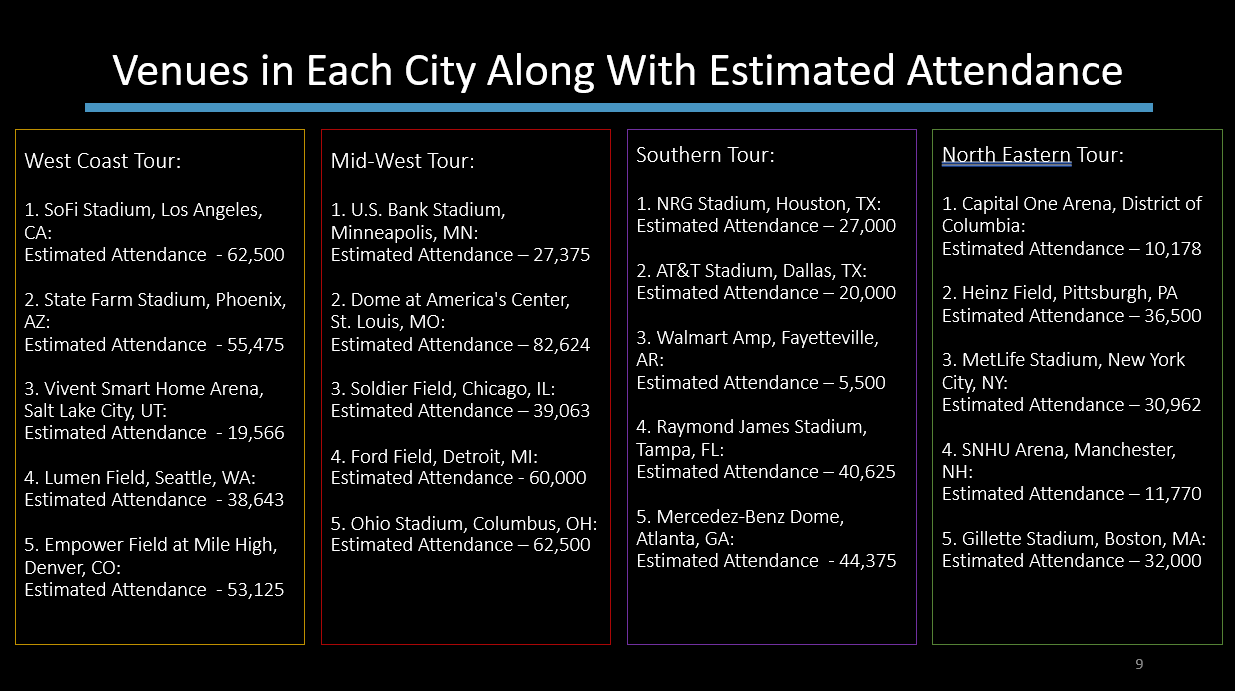
The other half of our data collection revolved around the distances between each venue. We needed to calculate the distance between every venue in order for the heuristic model to have a proper distance matrix to work off of. Below, you can find the venues that we chose for each region of the tour, along with the estimated attendances.
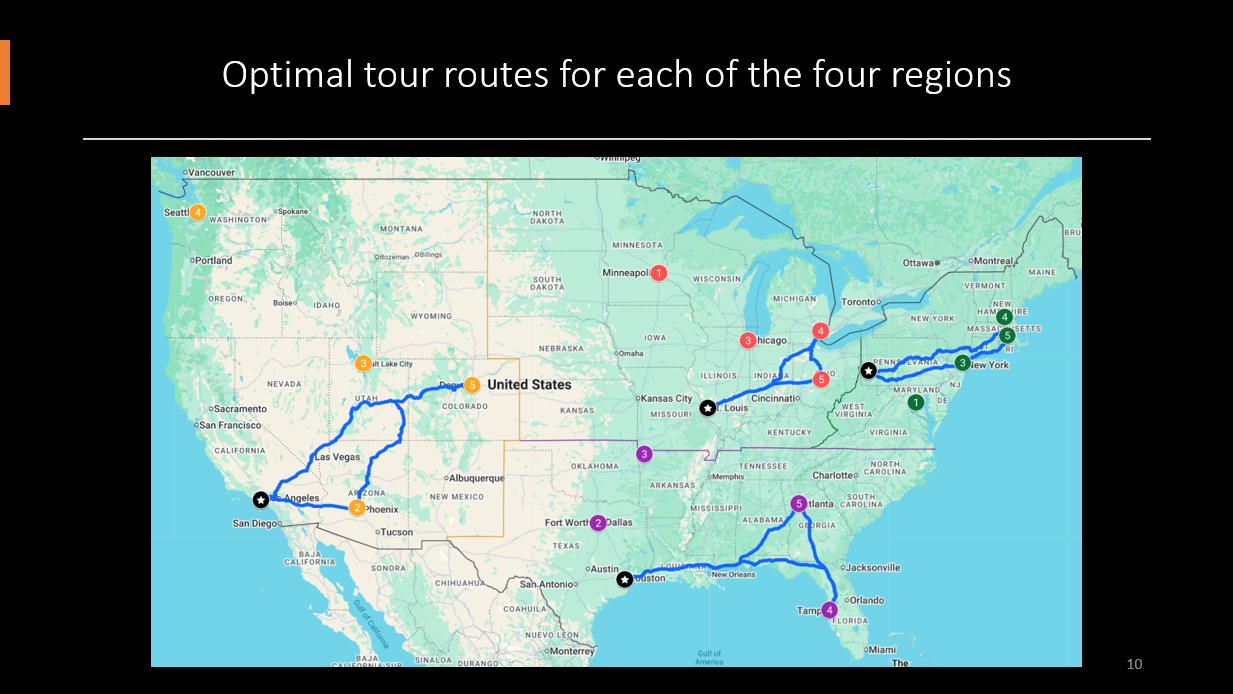
The slide below outlines the optimal routes in each region, solved by our optimization model. For the purposes of this project, we only decided to solve for a 12 show tour, it is easy to see how our model could be expanded as needed for a larger tour, doing this would just require more time committed to calculating venue distances. Beyond this, the only remaining step for a tour manager would be to connect the final stops and starting stops of each region.
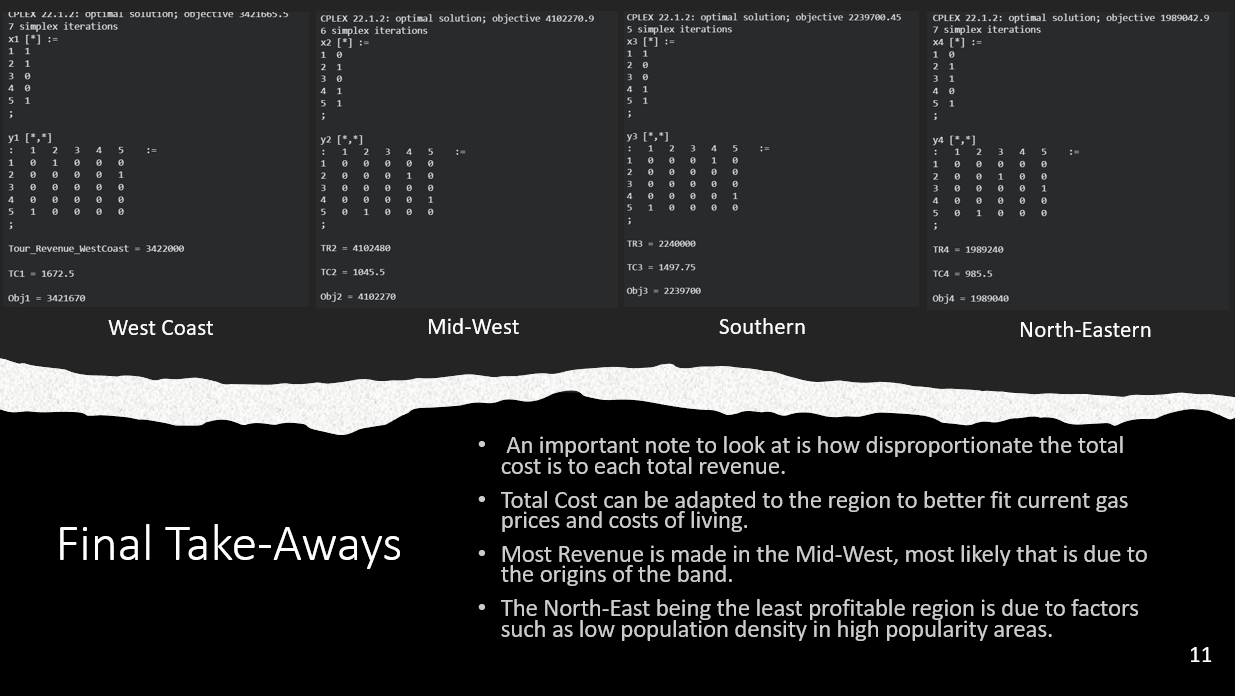
Finally, we wanted to show the exact output of our model, detailing the total cost, total revenue, and final objective value of each region. We have theorized that the reason for the Mid-West region being the most profitable is due to the fact the band originated in Columbus, Ohio. We also believe the reason for the North-East being the least profitable is because the ares where the band is most popular is home to very low population densities.
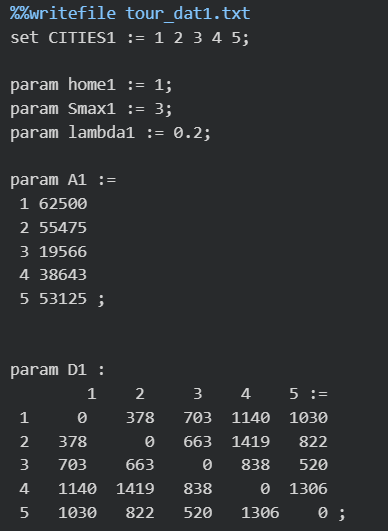
Now, I would like to highlight a snippet of what our code for this project looked like. The following images show our model formulation and data specifications for the West-Coast Tour. Each following tour model after this (including our heuristic style larger model) is built very similarly.
I am particularly please with our lambda function. That value allows us to change the foundation of the objective function. Without it, we would only have a distance optimizing model, but with it, we are able to decide how much “fan attendance” plays a role in the final tour.
To reflect on this project, I felt it was a fantastic experience for learning and improving my collaborative abilities, as well as my technical skills building optimization models. I am very proud of what me and Nathan were able to accomplish over a span of only 6 weeks. We were forced to utilize skills that we developed from other classes like data visualization, project management, and computing methods. If we were given more time, I would love to revisit our heuristic approach to see if we could refine the model to make it more accurate, I feel that was our biggest shortcoming of the project.